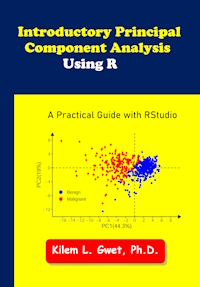
Introductory Principal Component Analysis Using R
A non-mathematical, RStudio-based walkthrough of Principal Component Analysis (PCA). No prior R experience is assumed beyond ordinary computer and analytical skills — some comfort with statistical reasoning helps, since PCA is an advanced technique, but the book explains it conceptually rather than through heavy derivation, aimed at analysts who want PCA as a practical, working skill.
Preliminaries, six chapters, an appendix, and back matters
R scripts & datasets
Every dataset used in the book's worked examples, grouped by the chapter that introduces it.
Data on the 50 U.S. states.
The Motor Trend Car Road Tests dataset.
Edgar Anderson's Iris dataset.
Wisconsin Diagnostic Breast Cancer dataset.
Two variables, X1 and X2, measured on 50 subjects.
Principal component scores computed for those same 50 subjects.
Employee compensation by gender, age, and marital status — Excel format.
The same compensation data, in CSV format.
Height and weight measurements for 15 individuals.
Wisconsin Diagnostic Breast Cancer dataset, CSV format.
The same dataset, in Excel format.
Demographic data for 7 employees (ID, gender, age, marital status).
Names, state of residence, and employment status for those same 7 employees.
2020 U.S. quarterly GDP by state, alongside 2019 population figures.
Demographic data for 7 employees (ID, gender, age, marital status).
Demographic data for 7 employees (ID, gender, age, marital status).