
Beginner's Guide to Principal Components
A practical, geometry-first introduction to Principal Component Analysis (PCA) — a statistical technique for reducing a large dataset down to the handful of dimensions that actually carry its information, worked through in Microsoft Excel rather than a statistical programming language.
What PCA actually does to your data
PCA was first described in 1901 and has been a staple of statistics and the social sciences ever since, but interest in it has surged again with the rise of big data — many modern data pipelines rely on some version of it to cut a large number of variables down to a manageable few.
The two figures below make the core idea concrete. Figure 1 shows a set of data points that need two coordinates, x and y, to describe — a two-dimensional problem. But nothing says those have to be the coordinates you analyze the data on. Any pair of directions at right angles to each other defines an equally valid coordinate system, and some of those alternative directions turn out to be far more useful than the original x–y axes.
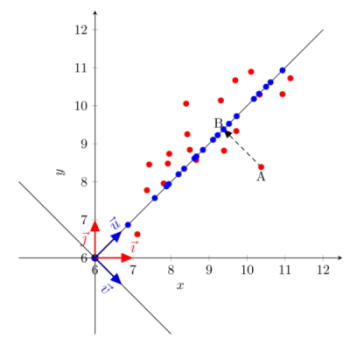
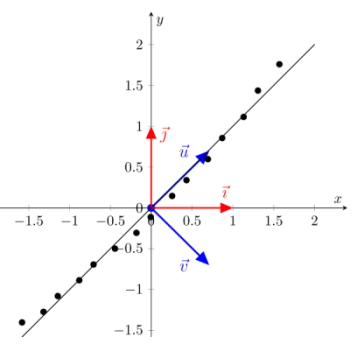
In Figure 1, one new direction captures as much of the data's spread as possible, and the other captures whatever variation is left over. If you only have room to analyze your data along a single dimension, that first direction — the first principal component — is the one worth keeping. The blue points are where the original red points land once projected onto it, and those projected values are what you'd actually analyze in the reduced, one-dimensional space.
Working out the principal components of a dataset comes down to three tasks, and the book walks through all three using nothing but Excel:
- Find the two directions themselves — mathematically, these are the eigenvectors of the correlation matrix between the variables being analyzed.
- Recompute every data point's coordinates in the new system. These are the principal component scores, and the variance of each score series equals the eigenvalue associated with its direction.
- Make sense of the components in terms of the original variables, by computing the covariance between each score series and each original variable — known as the component loadings.
Figure 2 shows the payoff when it works well: because the data points line up almost exactly along the first principal component, reducing two dimensions down to one loses almost no information at all.
Preliminaries, three chapters, three appendices
Download the first few pages of each chapter free before buying the full PDF.
Follow along in Excel
pca.xlsm
The companion Excel workbook used throughout the book — every matrix calculation, eigenvector derivation, and worked example, rebuildable step by step in your own copy of Excel.
Download the workbook